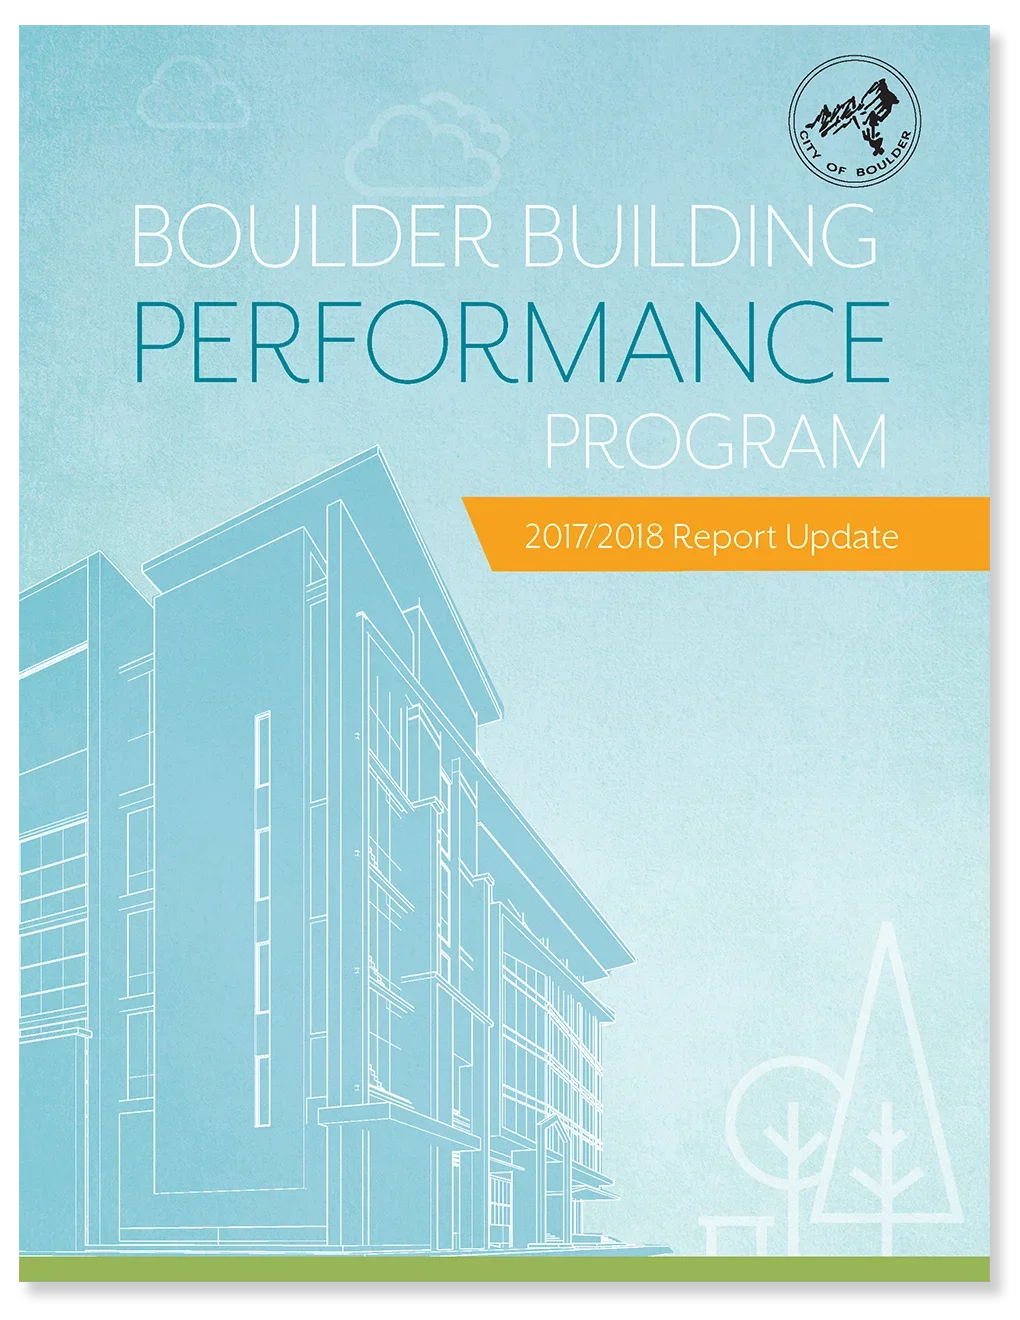
City of Boulder: Building Performance Report
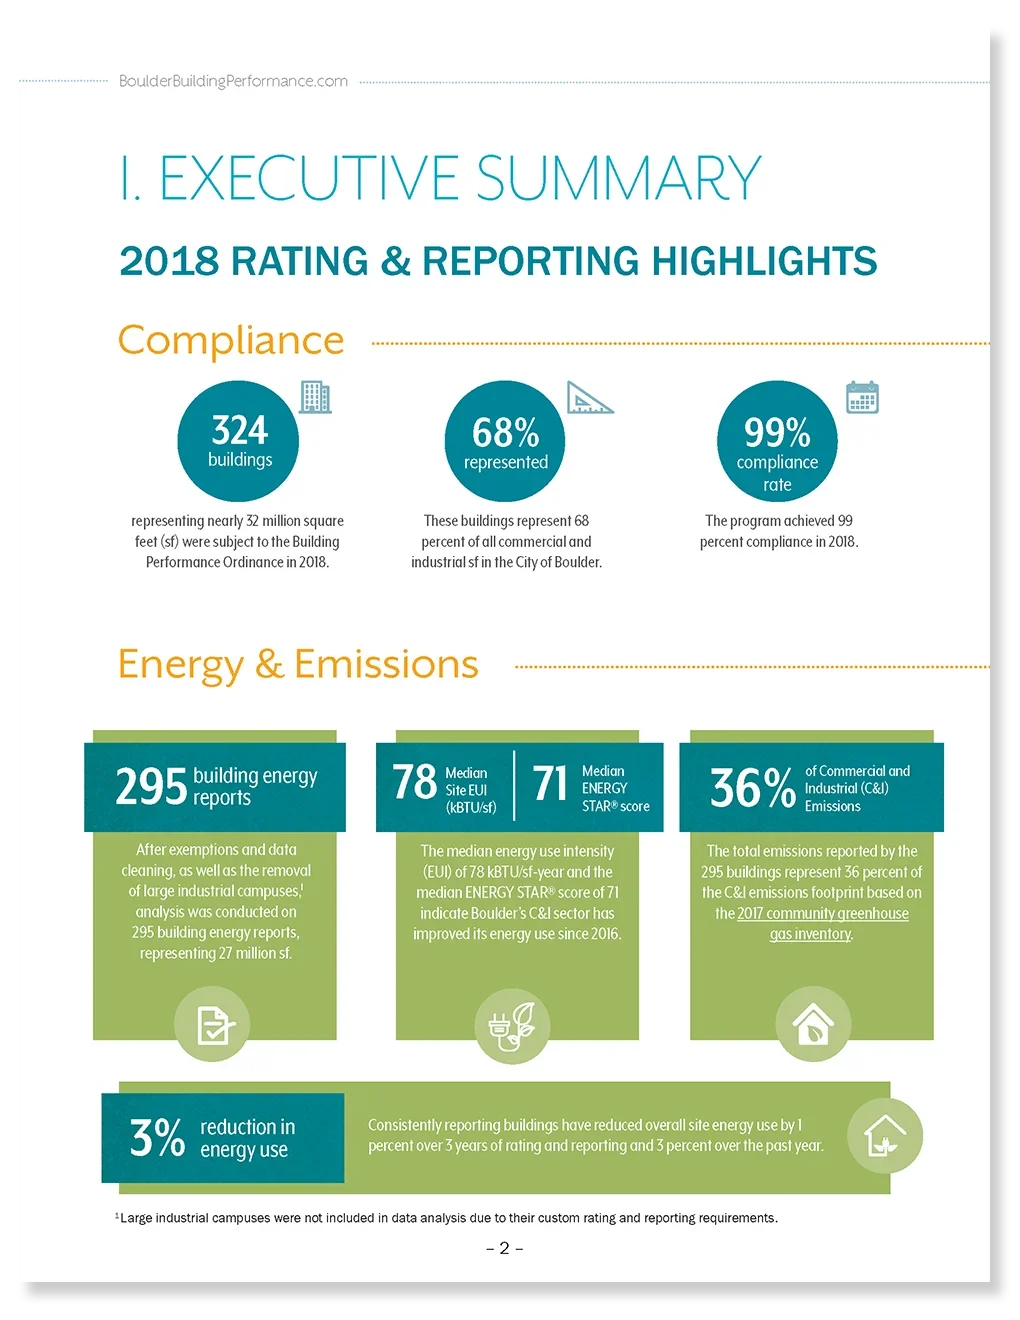
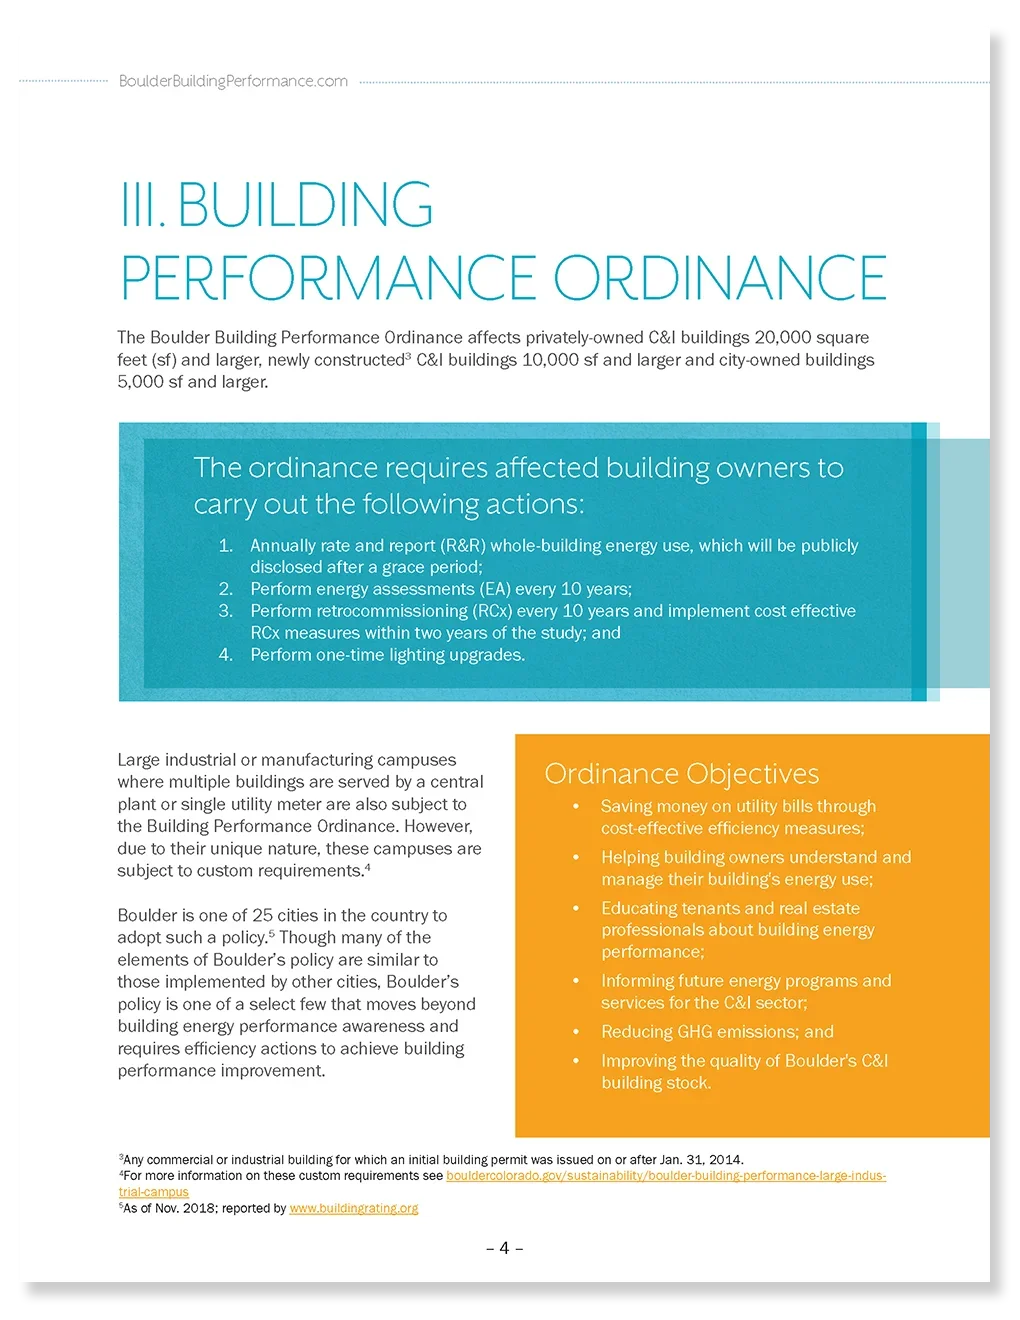
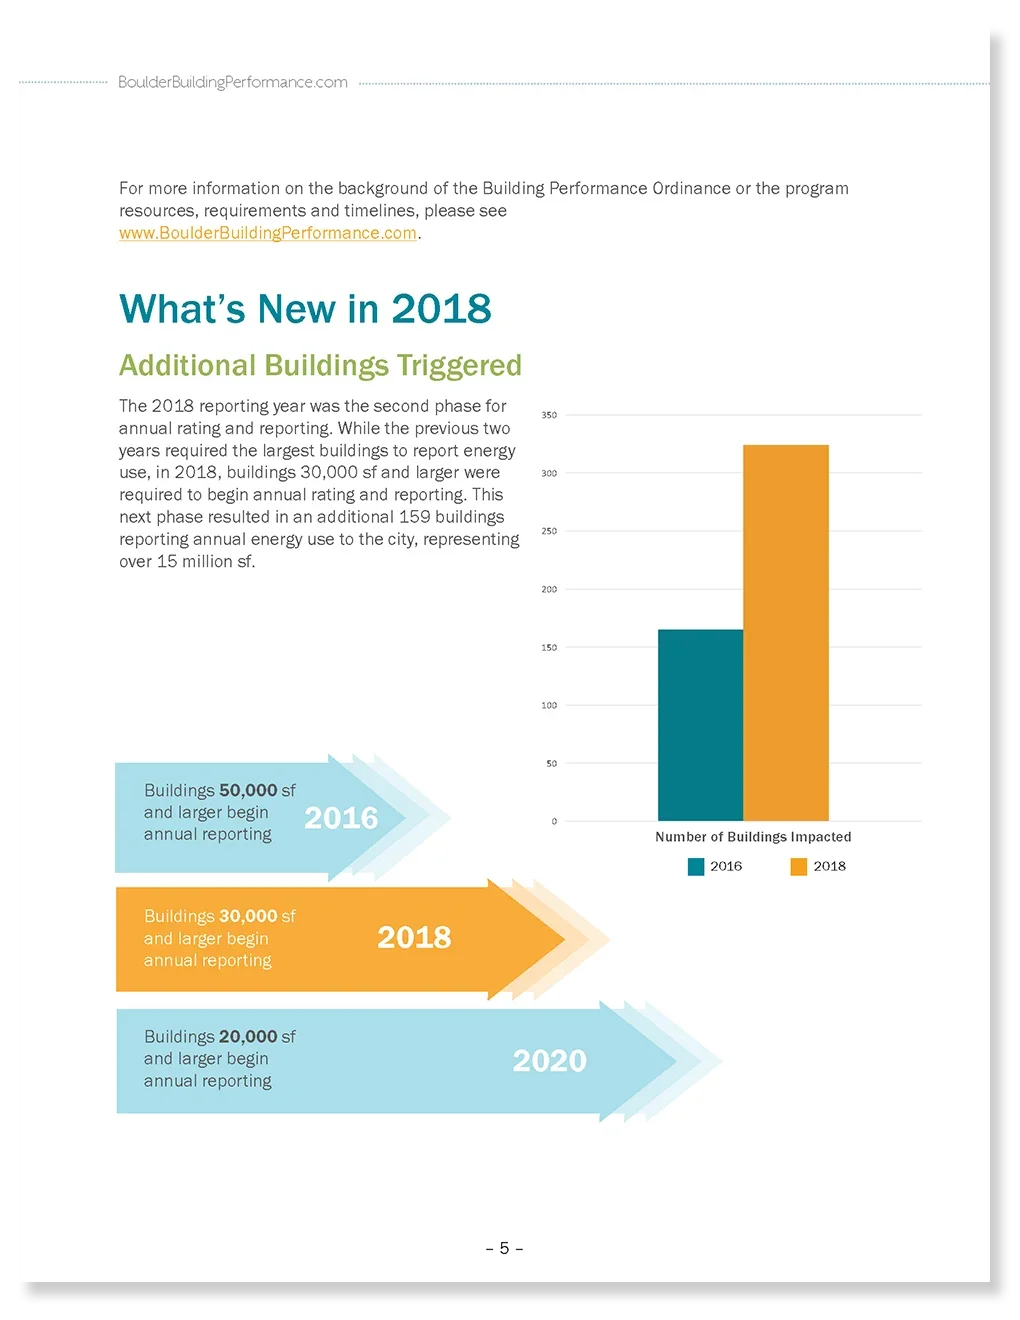
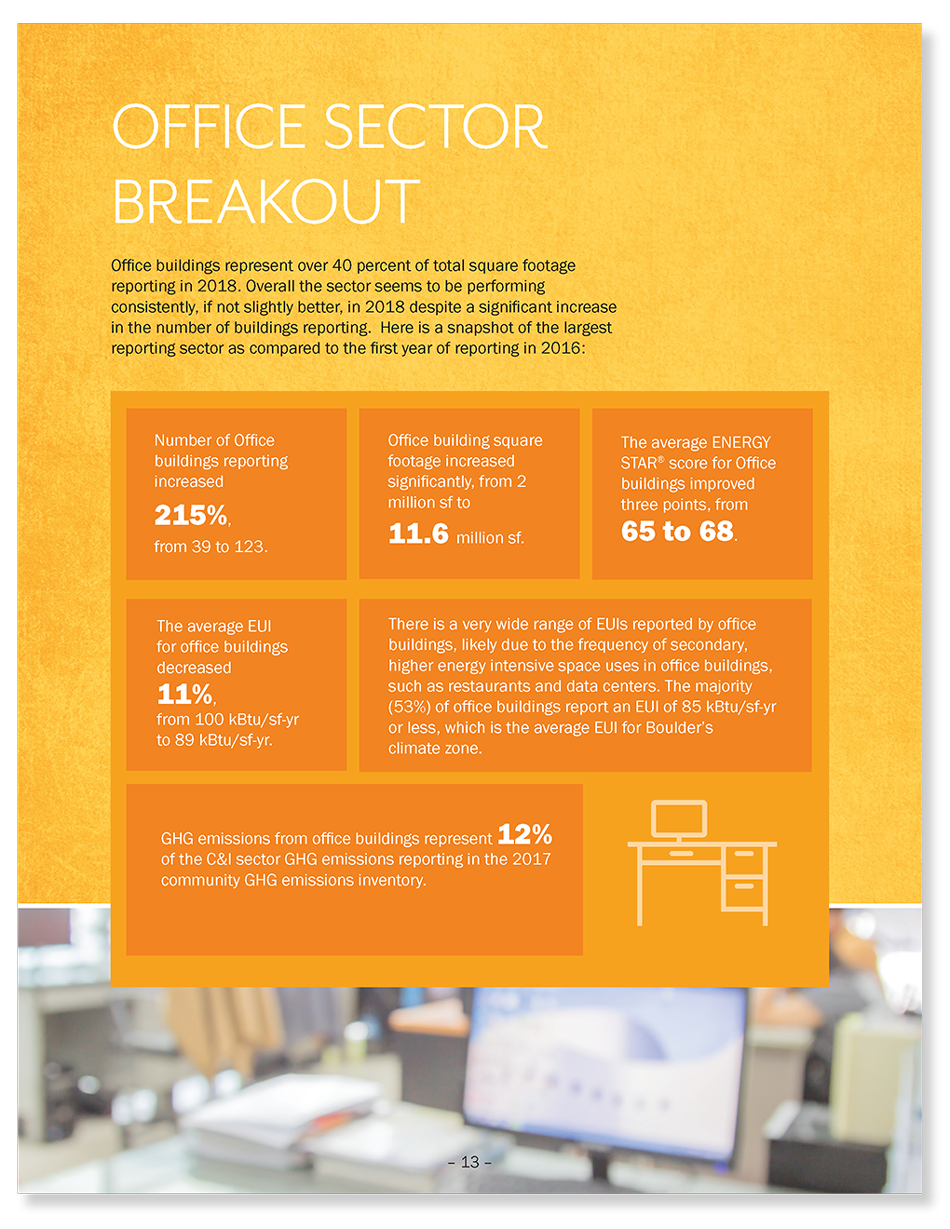
Challenge: Turn a report packed with data and technical information into something highly visual, easy to scan, and easy to understand.
Approach: Break the information into smaller sections and create a hierarchy through big typography, infographics, bright colors, and plenty of negative space so the most important data stands out. A consistent visual system across every page lets readers absorb the information without getting overwhelmed by it.